Number of TR1 in Germany | 🛑 | ▼
Registered TR1 in Germany
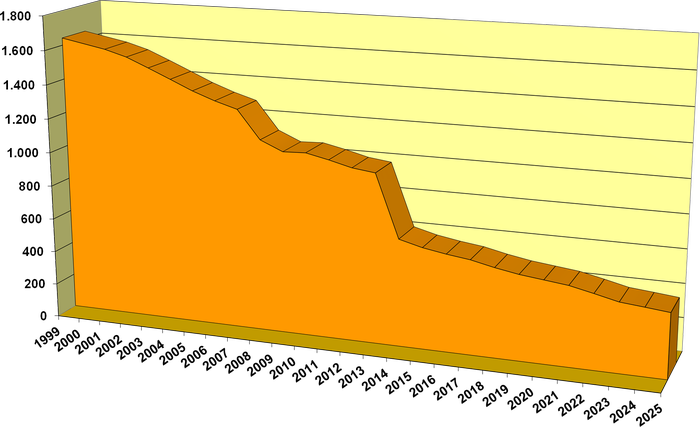
Interesting data from the German Kraftfahrt-Bundesamt (Federal Motor Transport Authority). The following table shows the total number of registered TR1 in Germany. But only official imports are counted. They can not differentiate a "grey" imported TR1 from other grey imported Yamaha models. TR1's with historical license plate ("Oldtimer- bzw. H-Kennzeichen") are also included.
2008: Starting 2008, the numbers do not include temporarily closed down/decommissioned bikes ("vorübergehende Stilllegungen/Außerbetriebsetzungen") anymore, and therefore might be to low! The numbers migth even get slightly higher from one year to another as from 2009 to 2010.
2014: In the course of quality-promoting measures, the inventory data of the Central Vehicle Register are compared to the type-approval data since 2014. In case of deviations an implausible type key number is then set to "000" and therefore not counted anymore.
This caused the major decline in numbers. For the original explanation from the KBA in German click here  .
.
2020: The KBA publishes now the "Stock of motor vehicles and trailers by manufacturer and type report". It includes all vehicle types for which a KBA manufacturer key and a national type key have been issued on the basis of the type approval. You can now search for all vehicles yourself. The report is a MS Excel file which can be found on this page. I will of course continue to extract the data for our TR1 and publish it in the table below. The report usually is updated around May/June and then reflects the figures from January 1st.
I always asked in the past / search now for HSN ("Herstellerschlüsselnummer" / "Manufacturer key number") 7101 which is "YAMAHA (J)" and TSN ("Typschlüsselnummer" / "Type key number") 168 which is "5A8 (XV 1000)".
| Date (January 1st) |
Number of TR1 (HSN 7101 / TSN 168) |
Difference | Percentage |
|---|---|---|---|
| 1999 | 1.642 | - | - |
| 2000 | - | - | - |
| 2001 | 1.592 | -50 | -3.0 % |
| 2002 | 1.555 | -37 | -2.3 % |
| 2003 | 1.500 | -55 | -3.5 % |
| 2004 | 1.443 | -57 | -3.8 % |
| 2005 | 1.385 | -58 | -4.0 % |
| 2006 | 1.337 | -48 | -3.5 % |
| 2007 | 1.298 | -39 | -2.9 % |
| 2008 * | 1.132 | -166 | -12.8 % |
| 2009 | 1.074 | -58 | -5.1 % |
| 2010 * | 1.079 | +5 | +0.5 % |
| 2011 | 1.050 | -29 | -2.7 % |
| 2012 | 1.016 | -34 | -3.2 % |
| 2013 | 999 | -17 | -1.7 % |
| 2014 * | 631 | -368 | -36.8 % |
| 2015 | 596 | -35 | -5.5 % |
| 2016 | 573 | -23 | -3.9 % |
| 2017 | 555 | -18 | -3.1 % |
| 2018 | 525 | -30 | -5.4 % |
| 2019 | 501 | -24 | -4.6 % |
| 2020 * | 485 | -16 | -3.2 % |
| 2021 | 469 | -16 | -3.3 % |
| 2022 | 439 | -30 | -6.4 % |
| 2023 | 407 | -32 | -7.3 % |
| 2024 | 394 | -13 | -3.2 % |
| 2025 | 380 | -14 | -3.6 % |
* = see above text


